Writing Debugger-Friendly Objects in C# & .NET
[C#, .NET]
One of the most powerful tools at the disposal of the modern developer is a good debugger.
Given that the craft of software development is by its very nature both a science and an art, problems (foreseen and otherwise) in code are inevitable.
Thus, it is imperative that not only do you have a good debugger, but a good debugging experience as well to help you both understand what is happening under the hood, but also to follow the flow of logic visually.
Let’s take a simple example to illustrate this concept.
For this, I will be using the JetBrains Rider IDE; however, this approach will still work with your editor of choice.
Assume you have the following type, Person:
public sealed record Person
{
    public string FirstName { get; init; }
    public string LastName { get; init; }
    public DateOnly DateOfBirth { get; init; }
}
And the following program:
var person = new Person
{
    FirstName = "James",
    LastName = "Bond",
    DateOfBirth = new DateOnly(1955, 05, 15),
};

Console.Write($"Created the person {person.FullName}");
The debugging experience can be experienced after setting a breakpoint as follows:
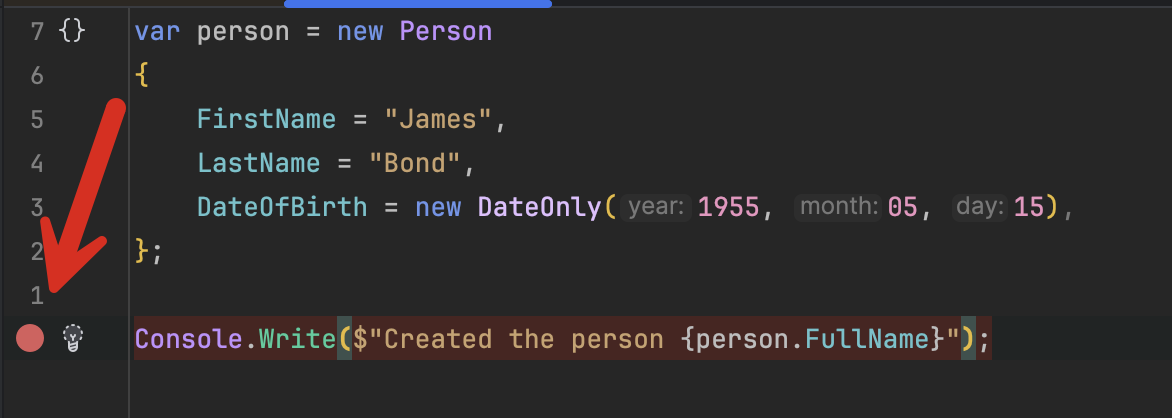
When you run the program, the debugger will stop at the breakpoint, allowing you to inspect various states of your objects.
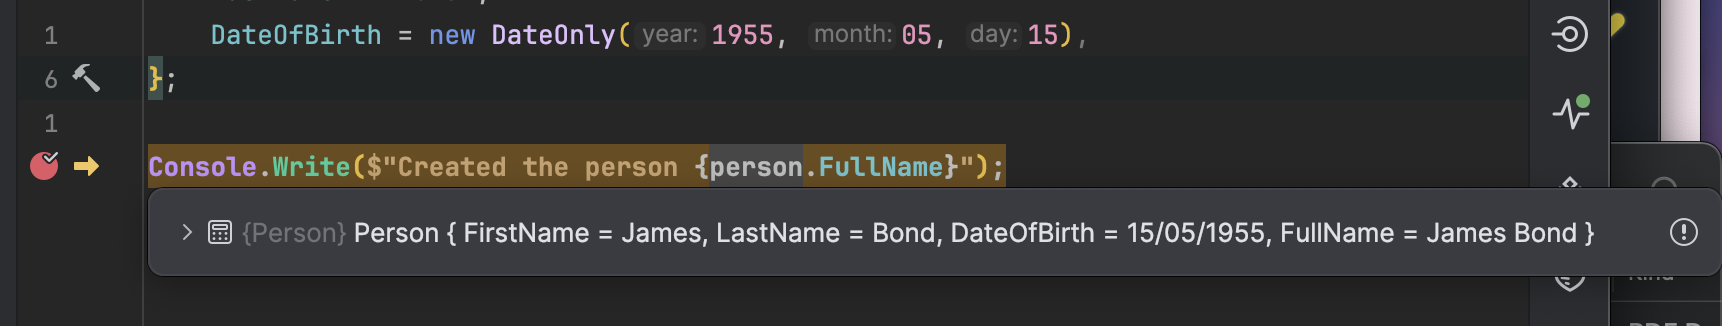
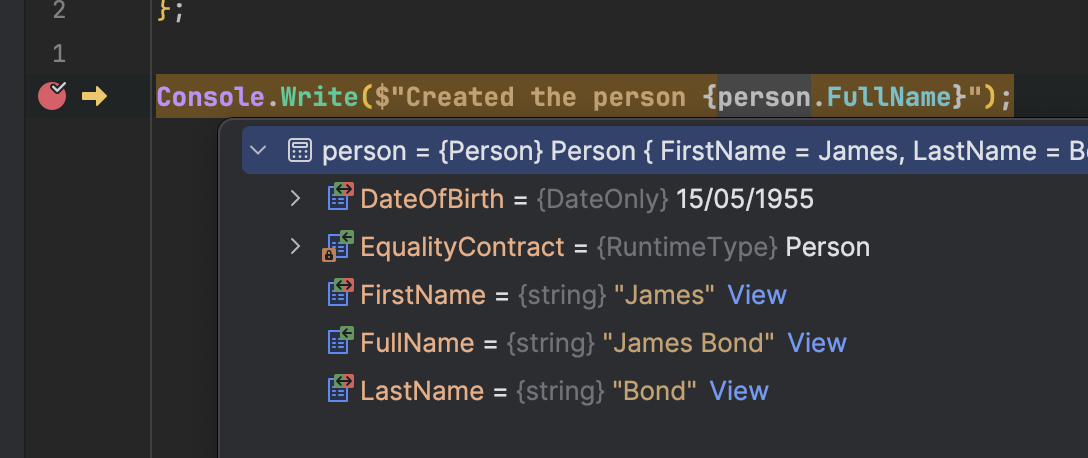
You can further expand the object to view it’s properties in a structured fashion.
Imagine now a situation where you have several objects.
For this, we will use Bogus to generate our data.
dotnet add package Bogus
We then add the following code:
var faker = new Faker<Person>()
    .RuleFor(x => x.FirstName, y => y.Name.FirstName())
    .RuleFor(x => x.LastName, y => y.Name.LastName())
    // Date in the past not more than 50 years go
    .RuleFor(x => x.DateOfBirth, y => y.Date.PastDateOnly(50));

// Generate 30 people
var people = faker.Generate(30);

Console.WriteLine($"Generated {people.Count} people");
If we set a breakpoint at the point where we are printing the message of the number of people generated, we see the following:
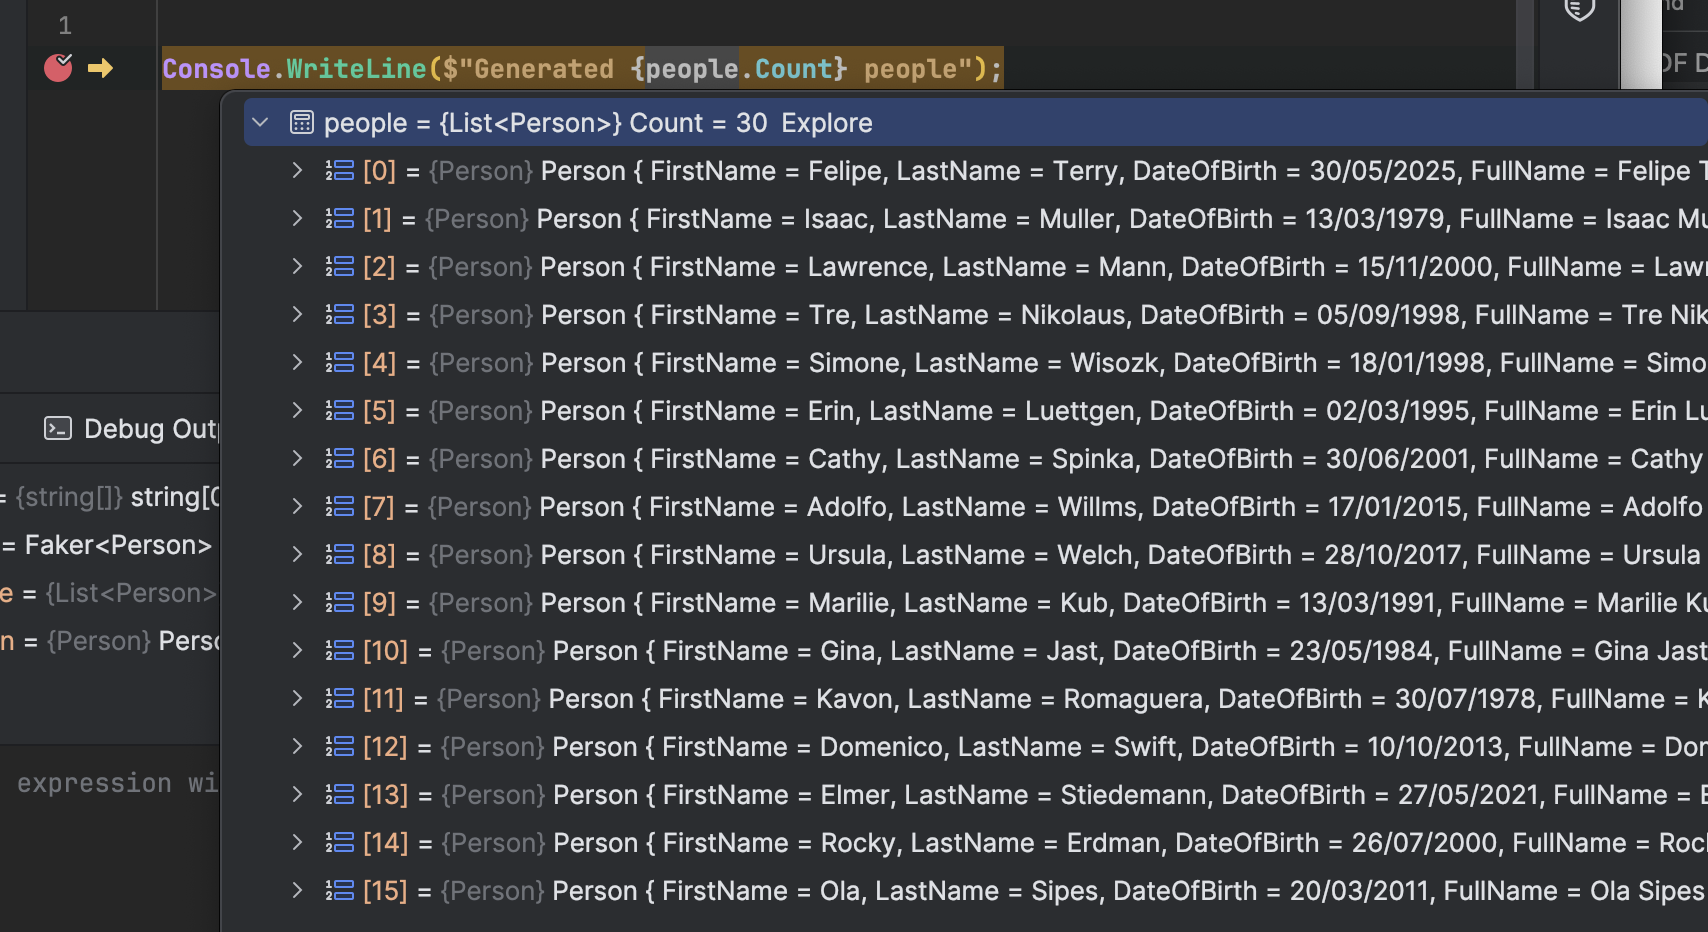
It’s busy, but it’s possible to see what is happening.
Now, suppose we make the Person a class, rather than a record.
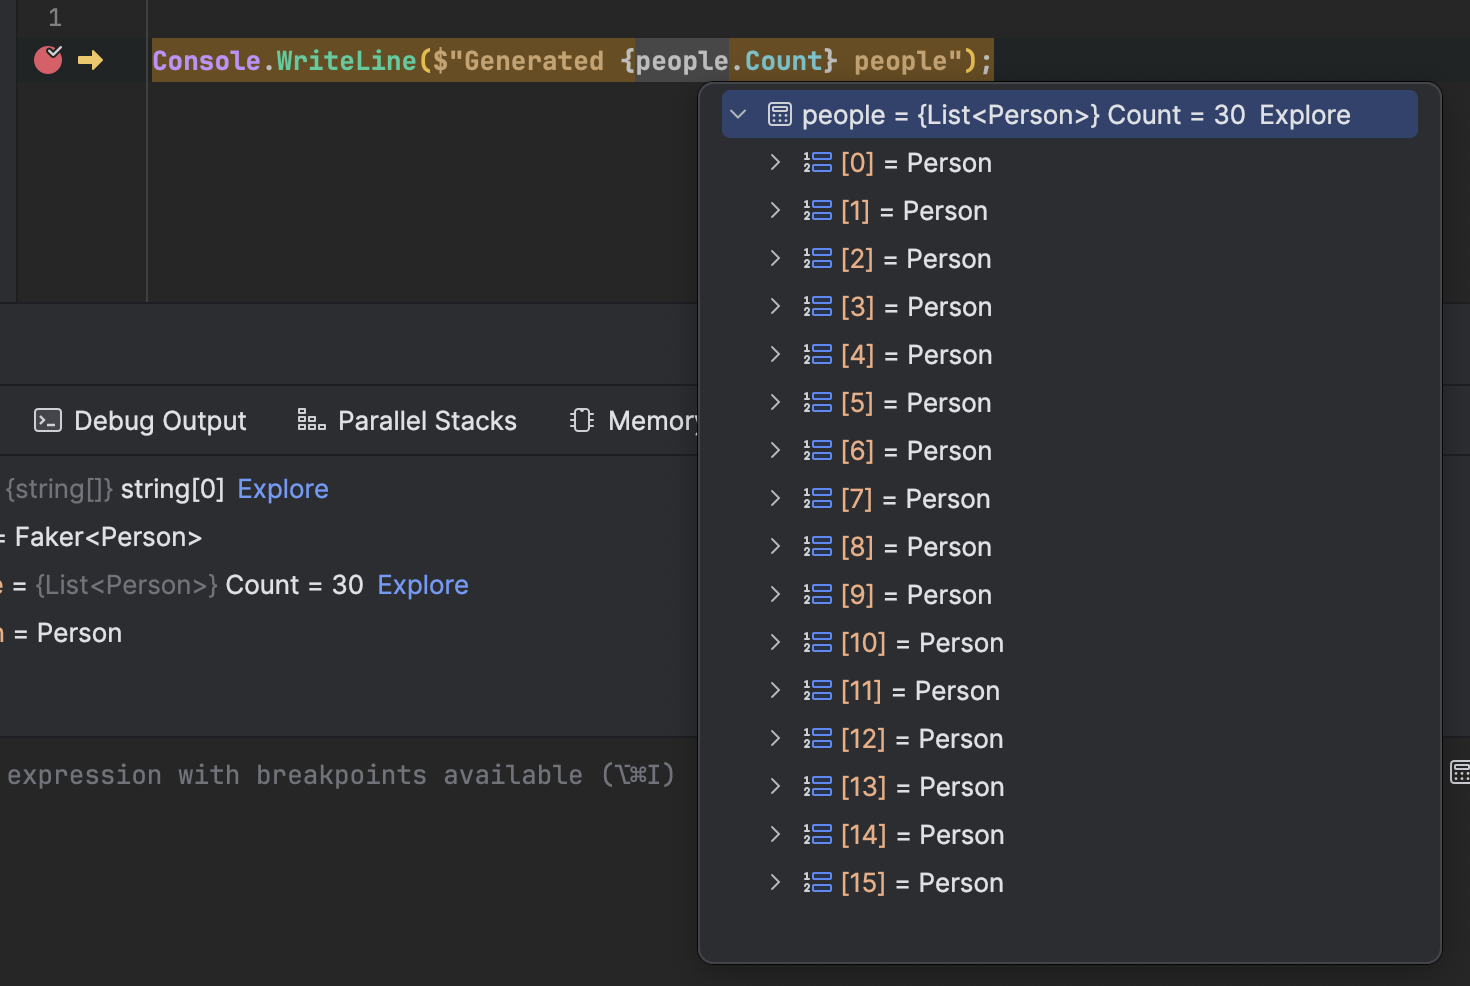
Note that this is much more difficult to visualize. You have to expand each item to view the details.
This is one of the benefits of record - you get a relatively complete implementation of ToString that basically lists all the properties.
Luckily, there is a solution to this - you can tell your IDE how to visualize your object using the DebuggerDisplay attribute.
With this, you can provide a string of how you would like your object to be represented.
using System.Diagnostics;

[DebuggerDisplay("Name: {FullName}; DateOfBirth: {DateOfBirth.ToString(\"d MMM yyyy\")}")]
public sealed class Person
{
    public required string FirstName { get; init; }
    public required string LastName { get; init; }
    public required DateOnly DateOfBirth { get; init; }
    public string FullName => $"{FirstName} {LastName}";
}
Of note here is that to format your objects you cannot do it like this:
"{DateOfBirth:d MMM yyyy}"
You must actually call ToString, and pass it a format string, as follows:
"{DateOfBirth.ToString(\"d MMM yyyy\")}"
If we now run our program, we see the following debugging experience:
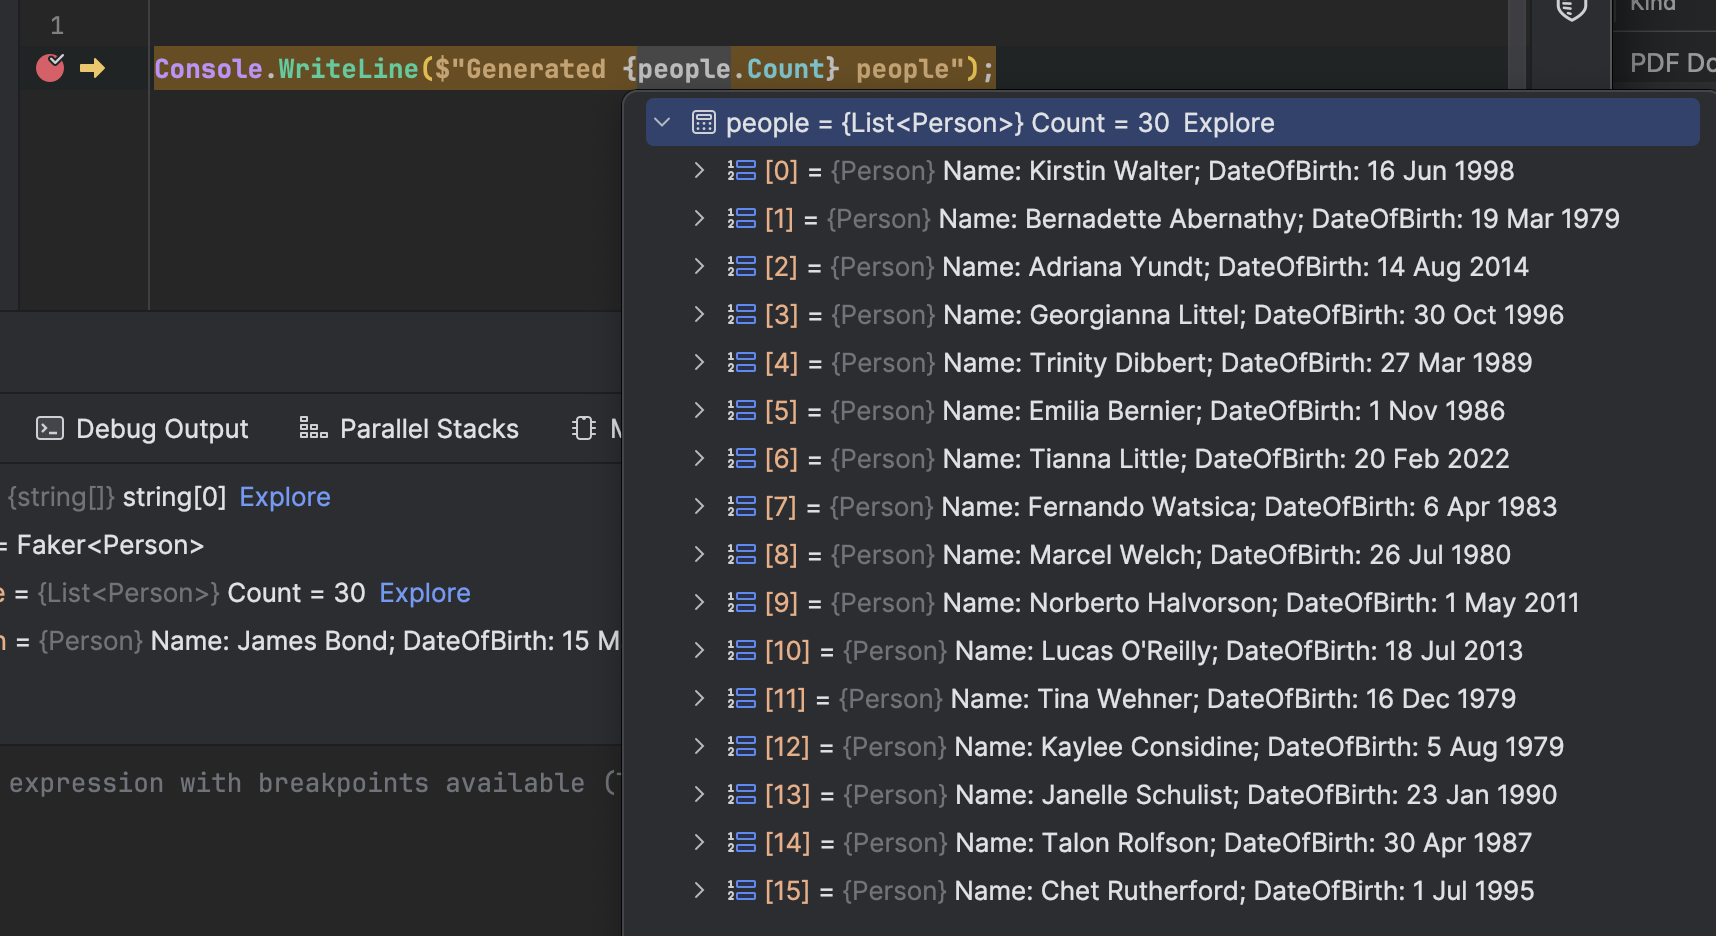
This is much easier to visualize without having to expand each object looking for one in particular.
The DebuggerDisplay attribute also works with records and structs.
TLDR
The DebuggerDisplay attribute allows you to write debugger-friendly objects that are easy to visualize.
The code is in my GitHub.
Happy hacking!