Viewing Elastic Search Indexes With ElasticVue
[Tools, ElasticSearch]
If you are integrating search into your applications, chances are you are using the excellent ElasticSearch.
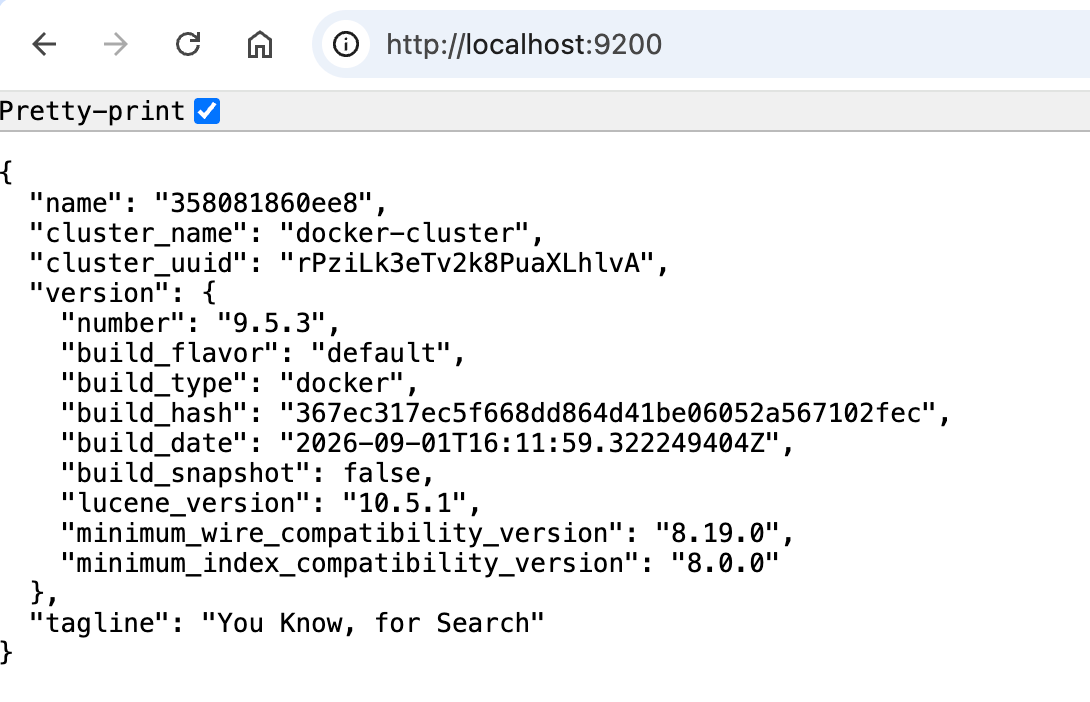
It is pretty trivial to check whether the service is up: send a GET request to the root of the sever on port 9200.
In my case this is http://localhost/9200
This should return something like this:
To view the actual indexes (assuming your code has indexed your data before) is a bit more work.
Send a GET request to the following address http://localhost:9200/_cat/indices.
This will return something like this:
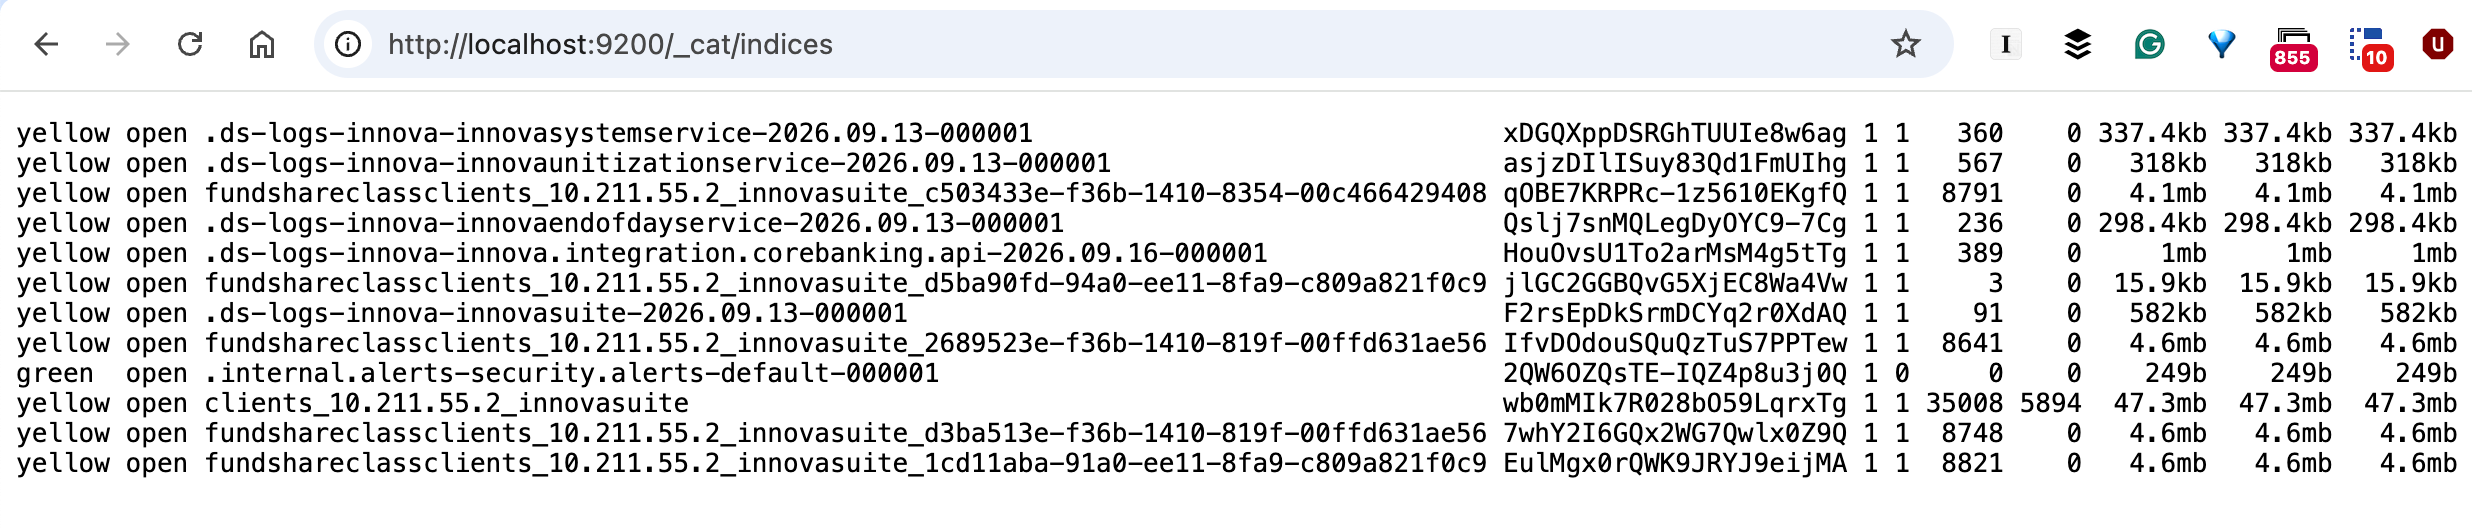
Which is a bit cryptic.
You can view a bit more detail (and column headers) by using the following GET request http://localhost:9200/_cat/indices?v.

Better, but still ungainly.
A better solution to this is the tool ElasticVue, available as a standalone desktop app or as browser plugin for your favourite browser, currently Chrome, Edge and Firefox.
It is also available as a docker container or a web app.
On macOS, you can install it using homebrew.
brew install --cask elasticvue
Upon launch, you will see the following config screen:
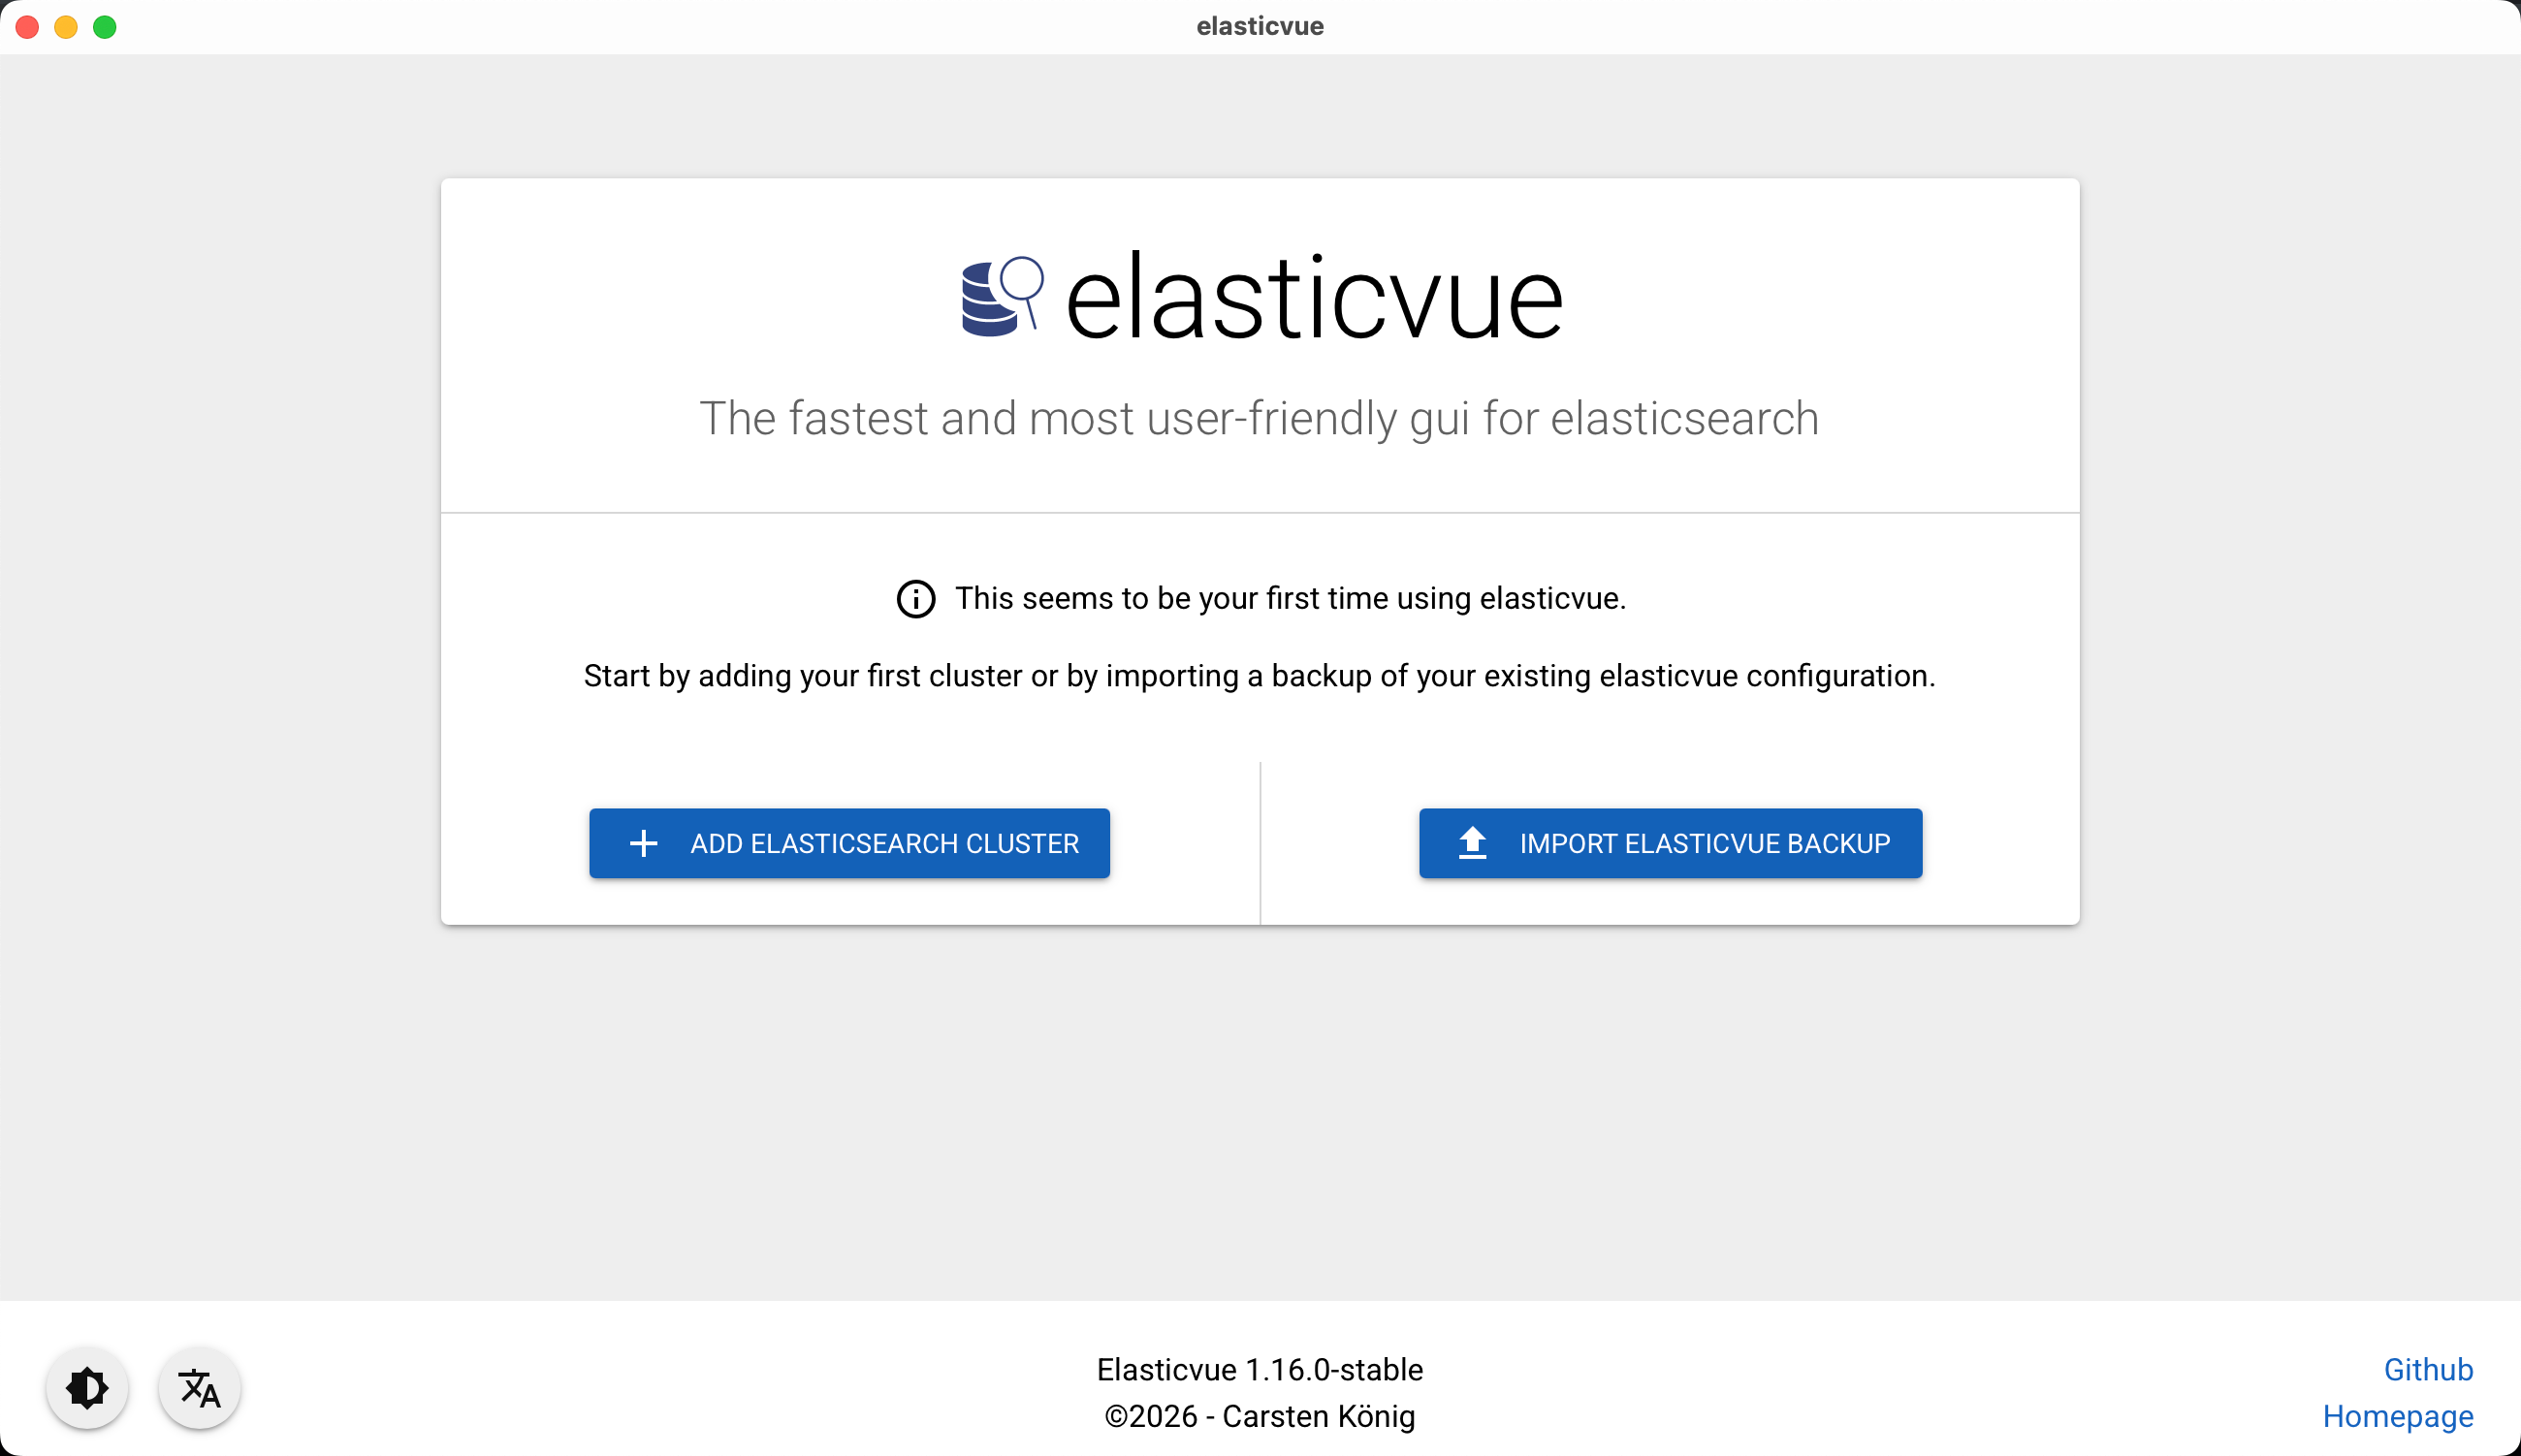
Click ‘Add Elastic Search Cluster’.
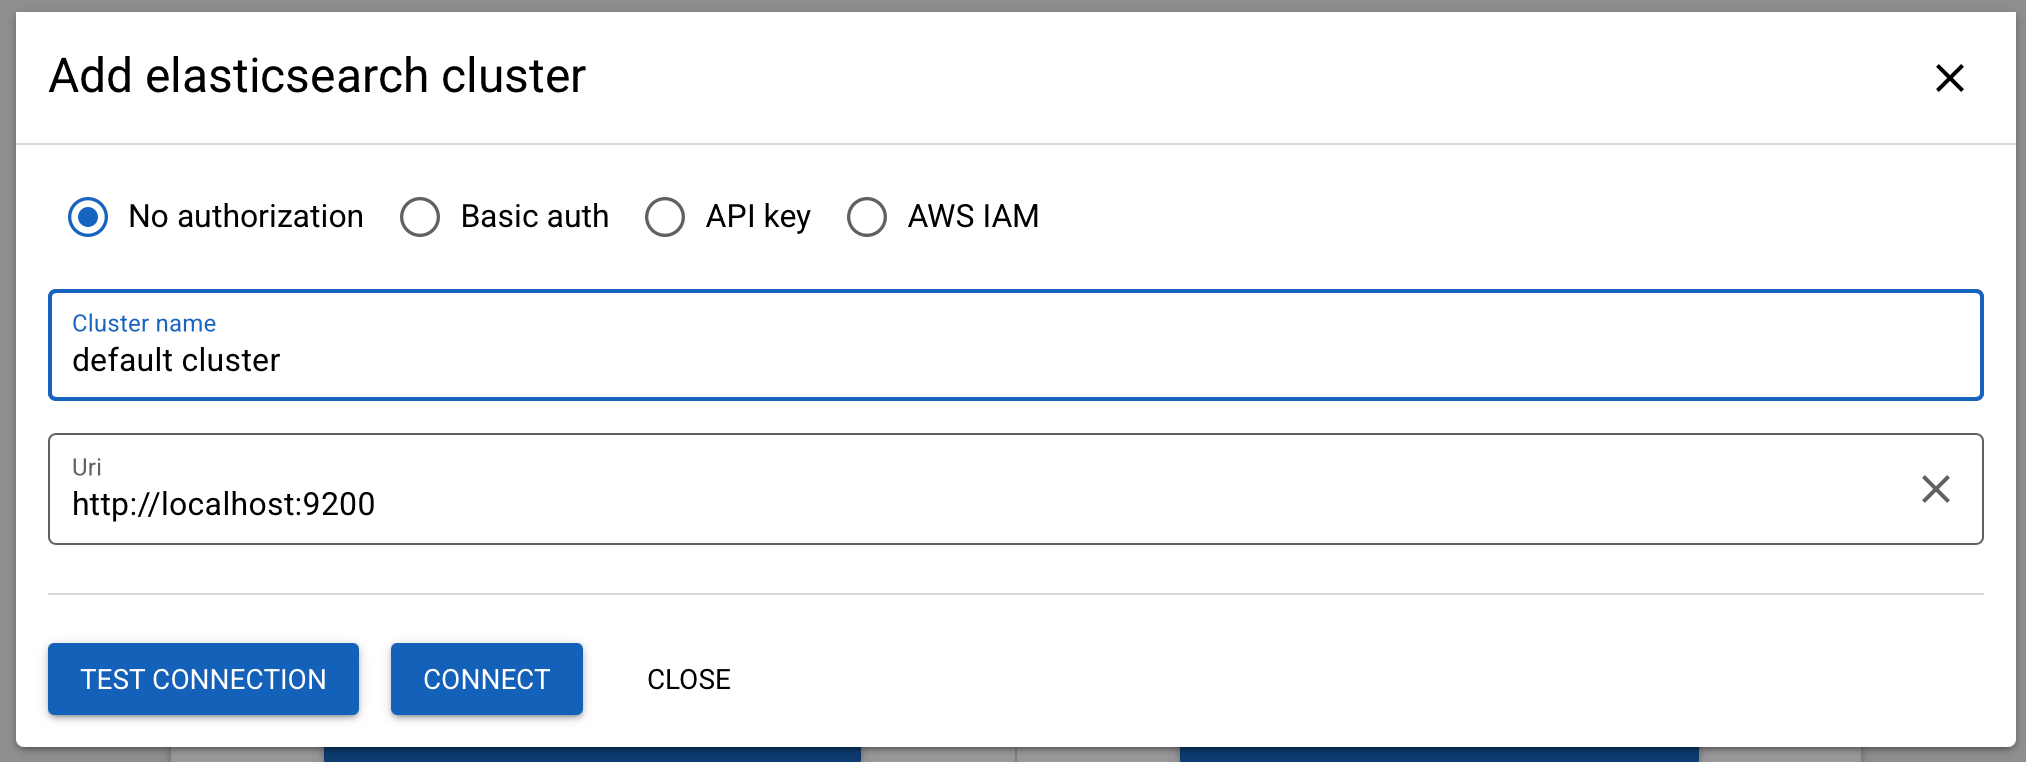
This will take you to a screen that shows the status of your closet.
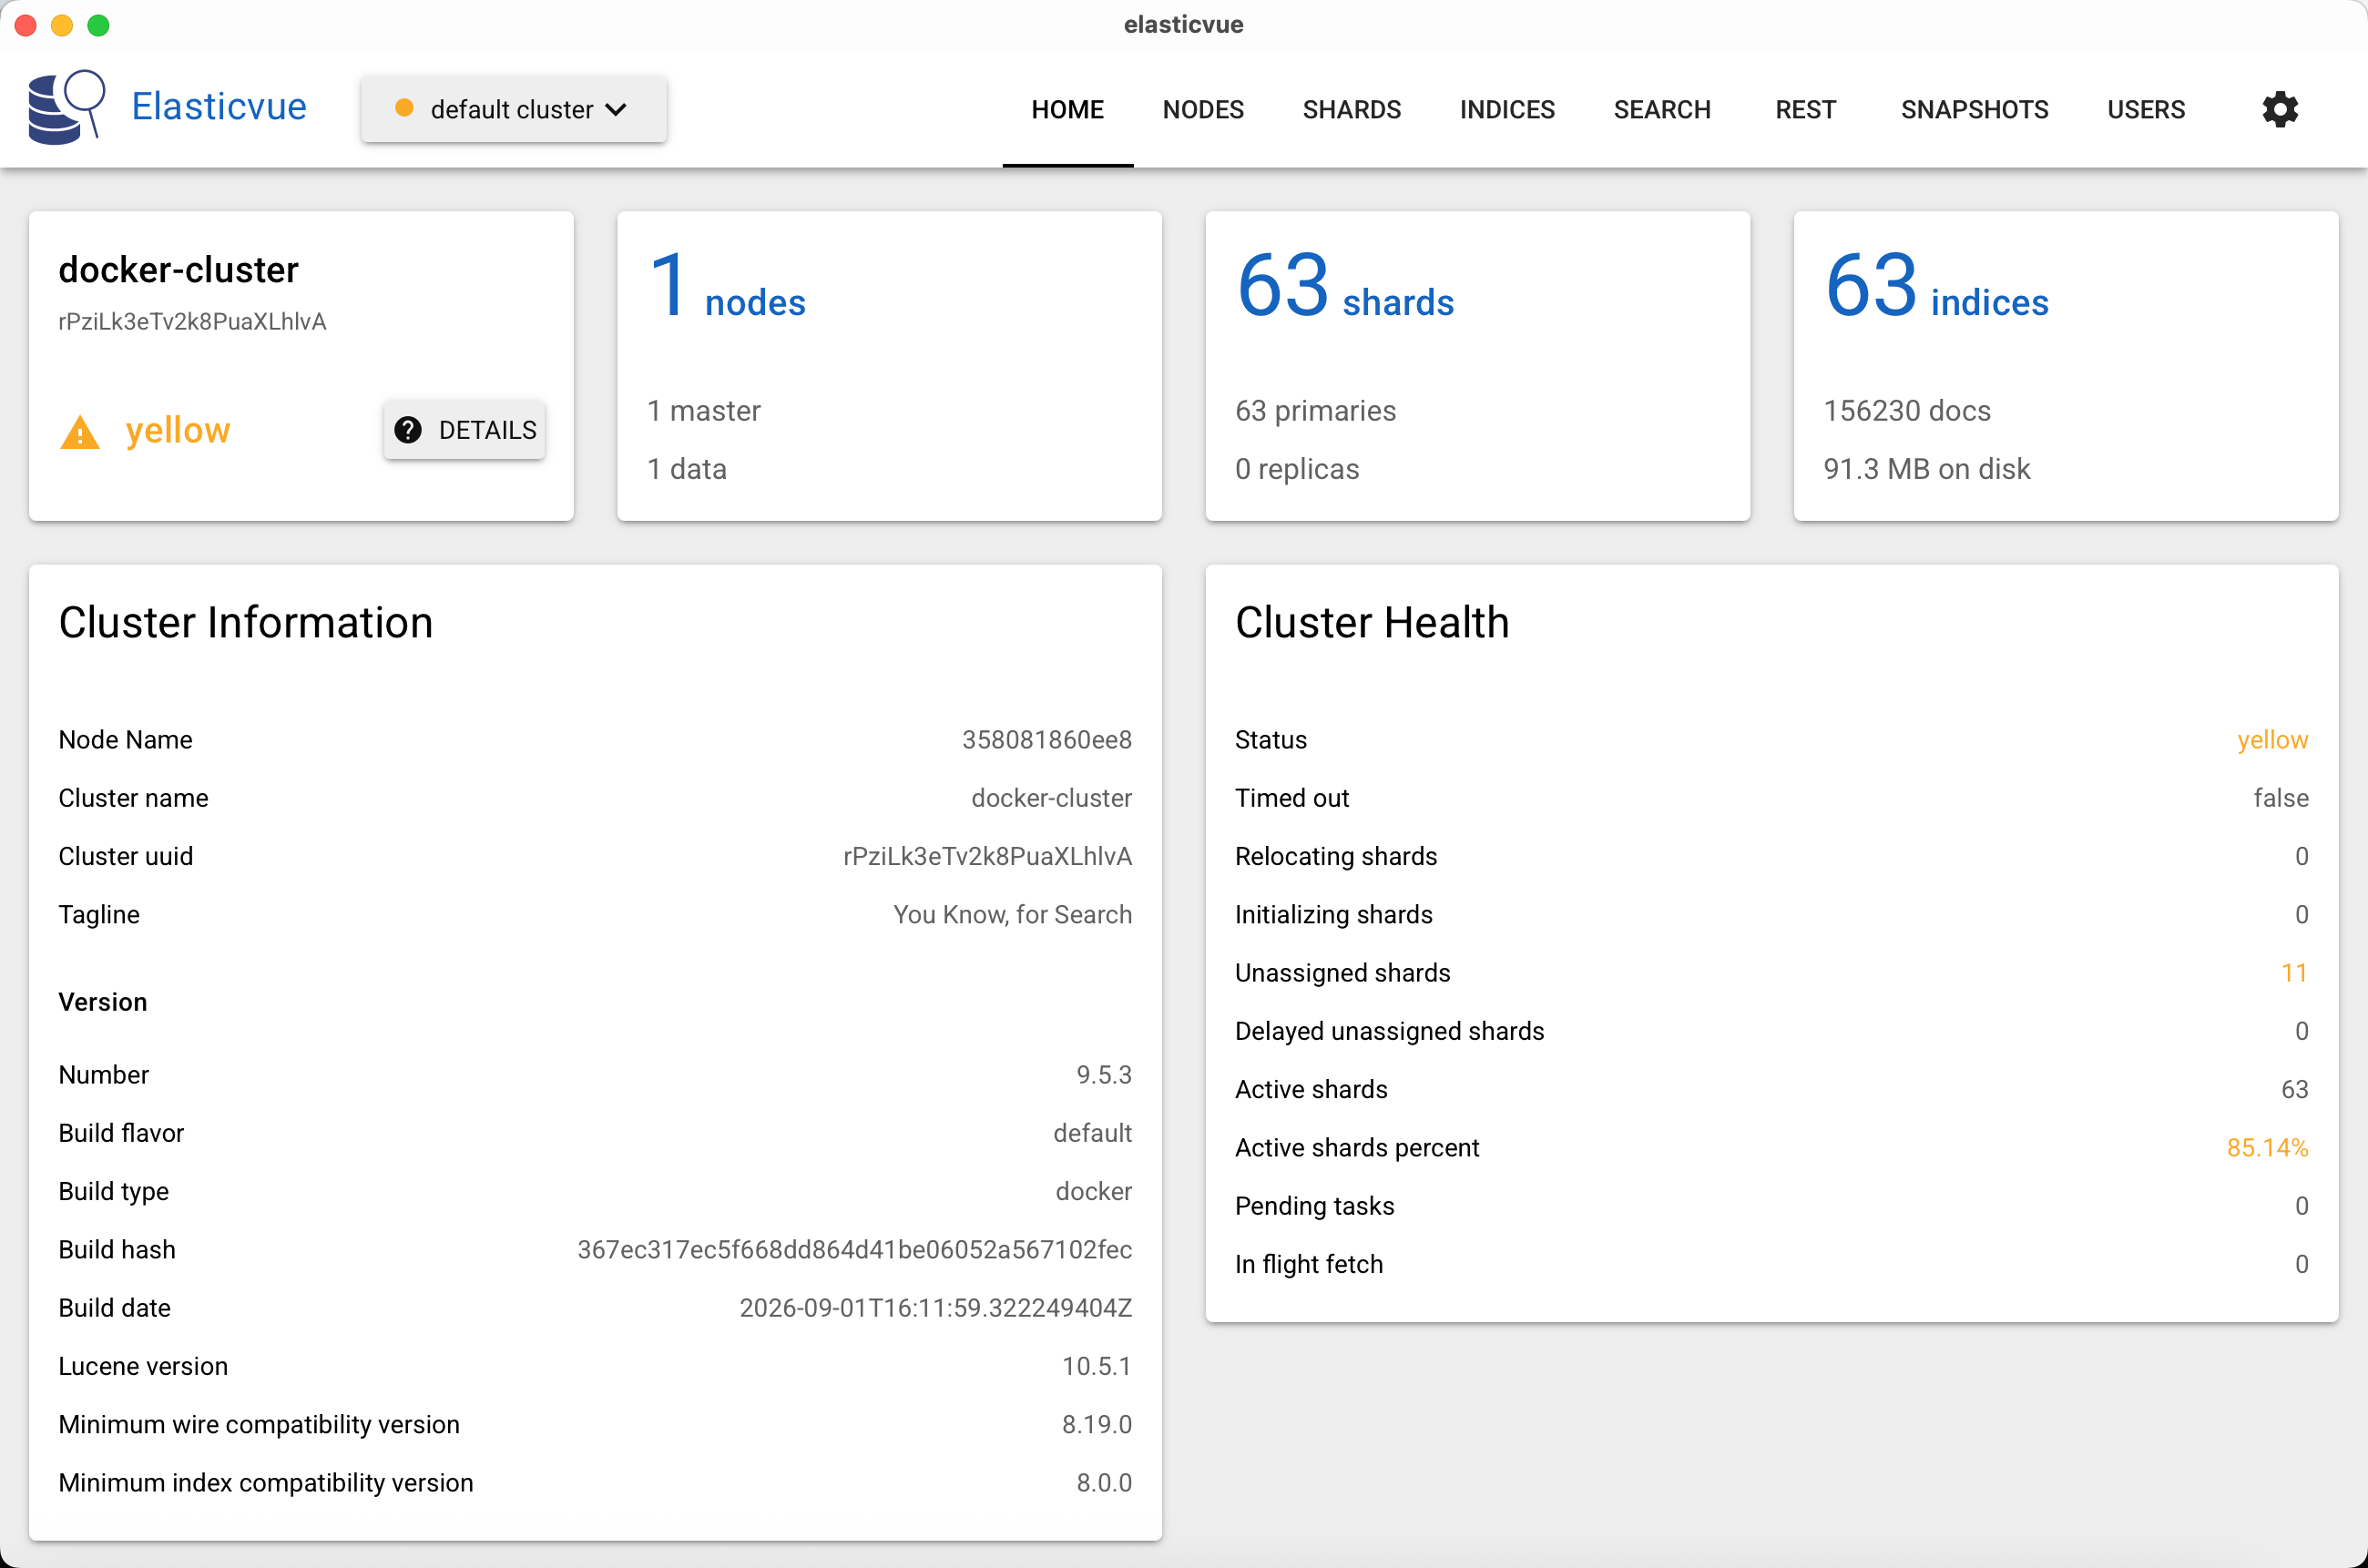
From here, click ‘indices’ to view the current indexes in the cluster.
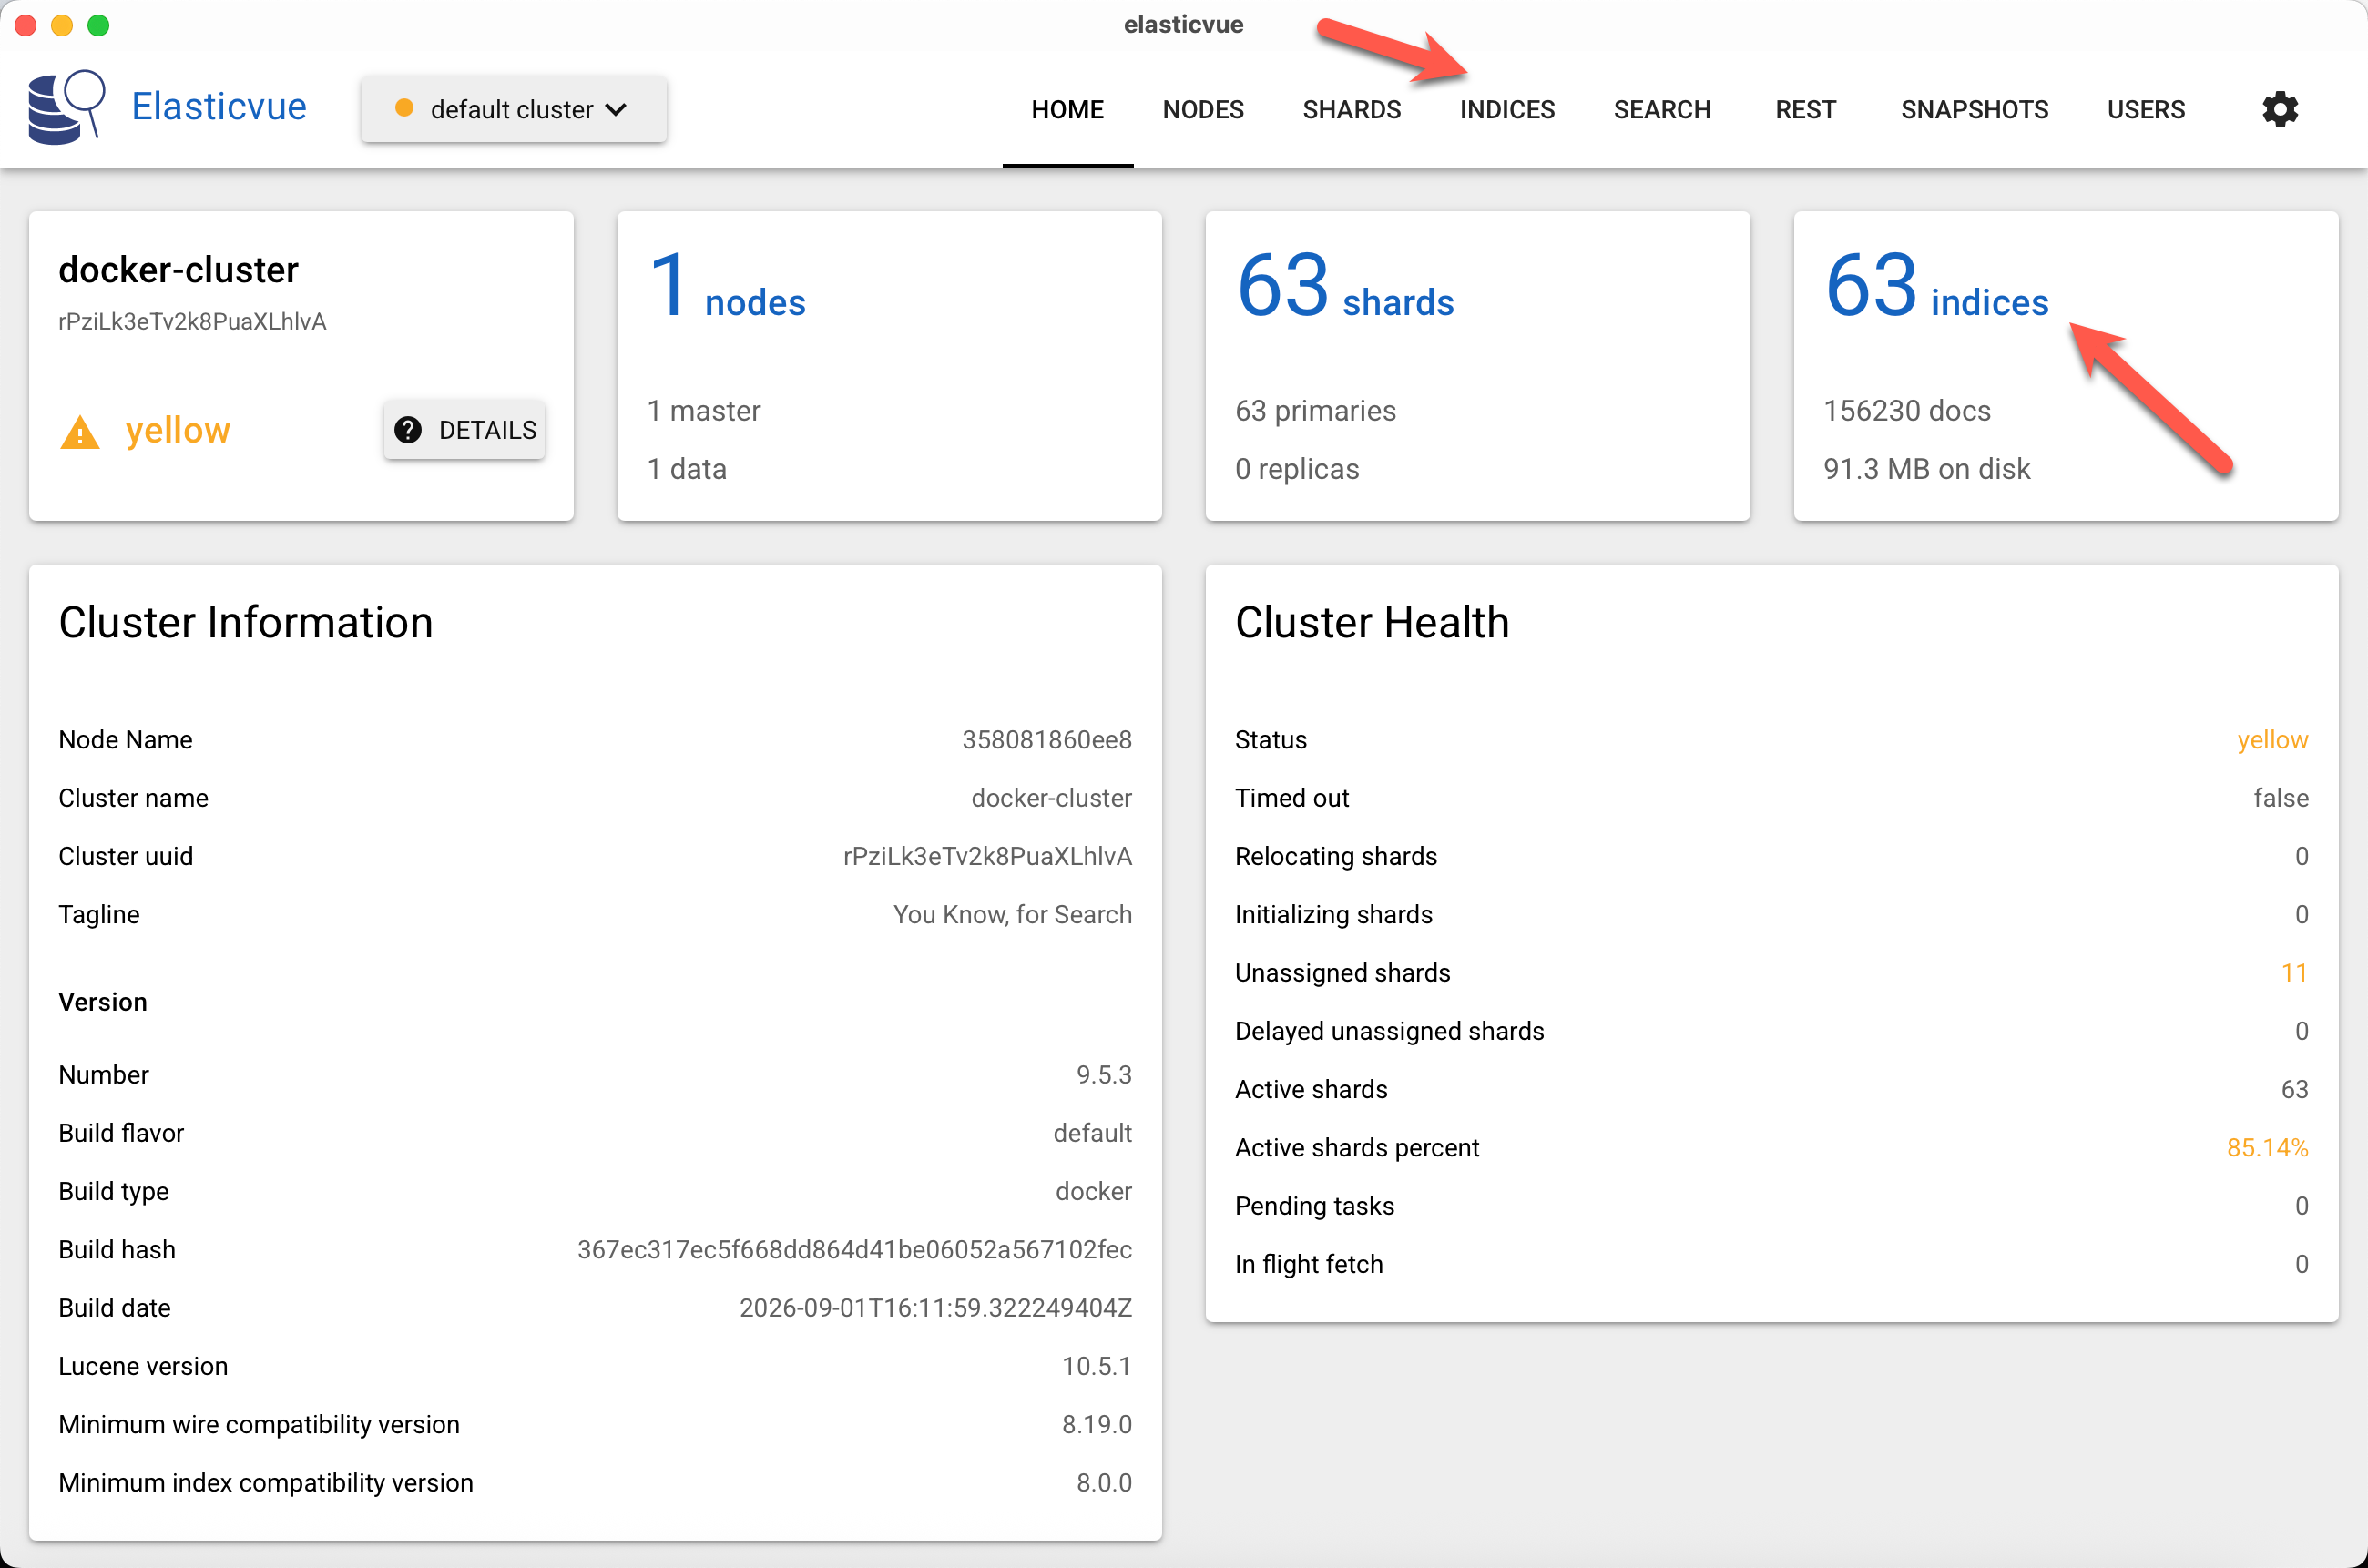
This will take you to a section where you can view the current indexes.
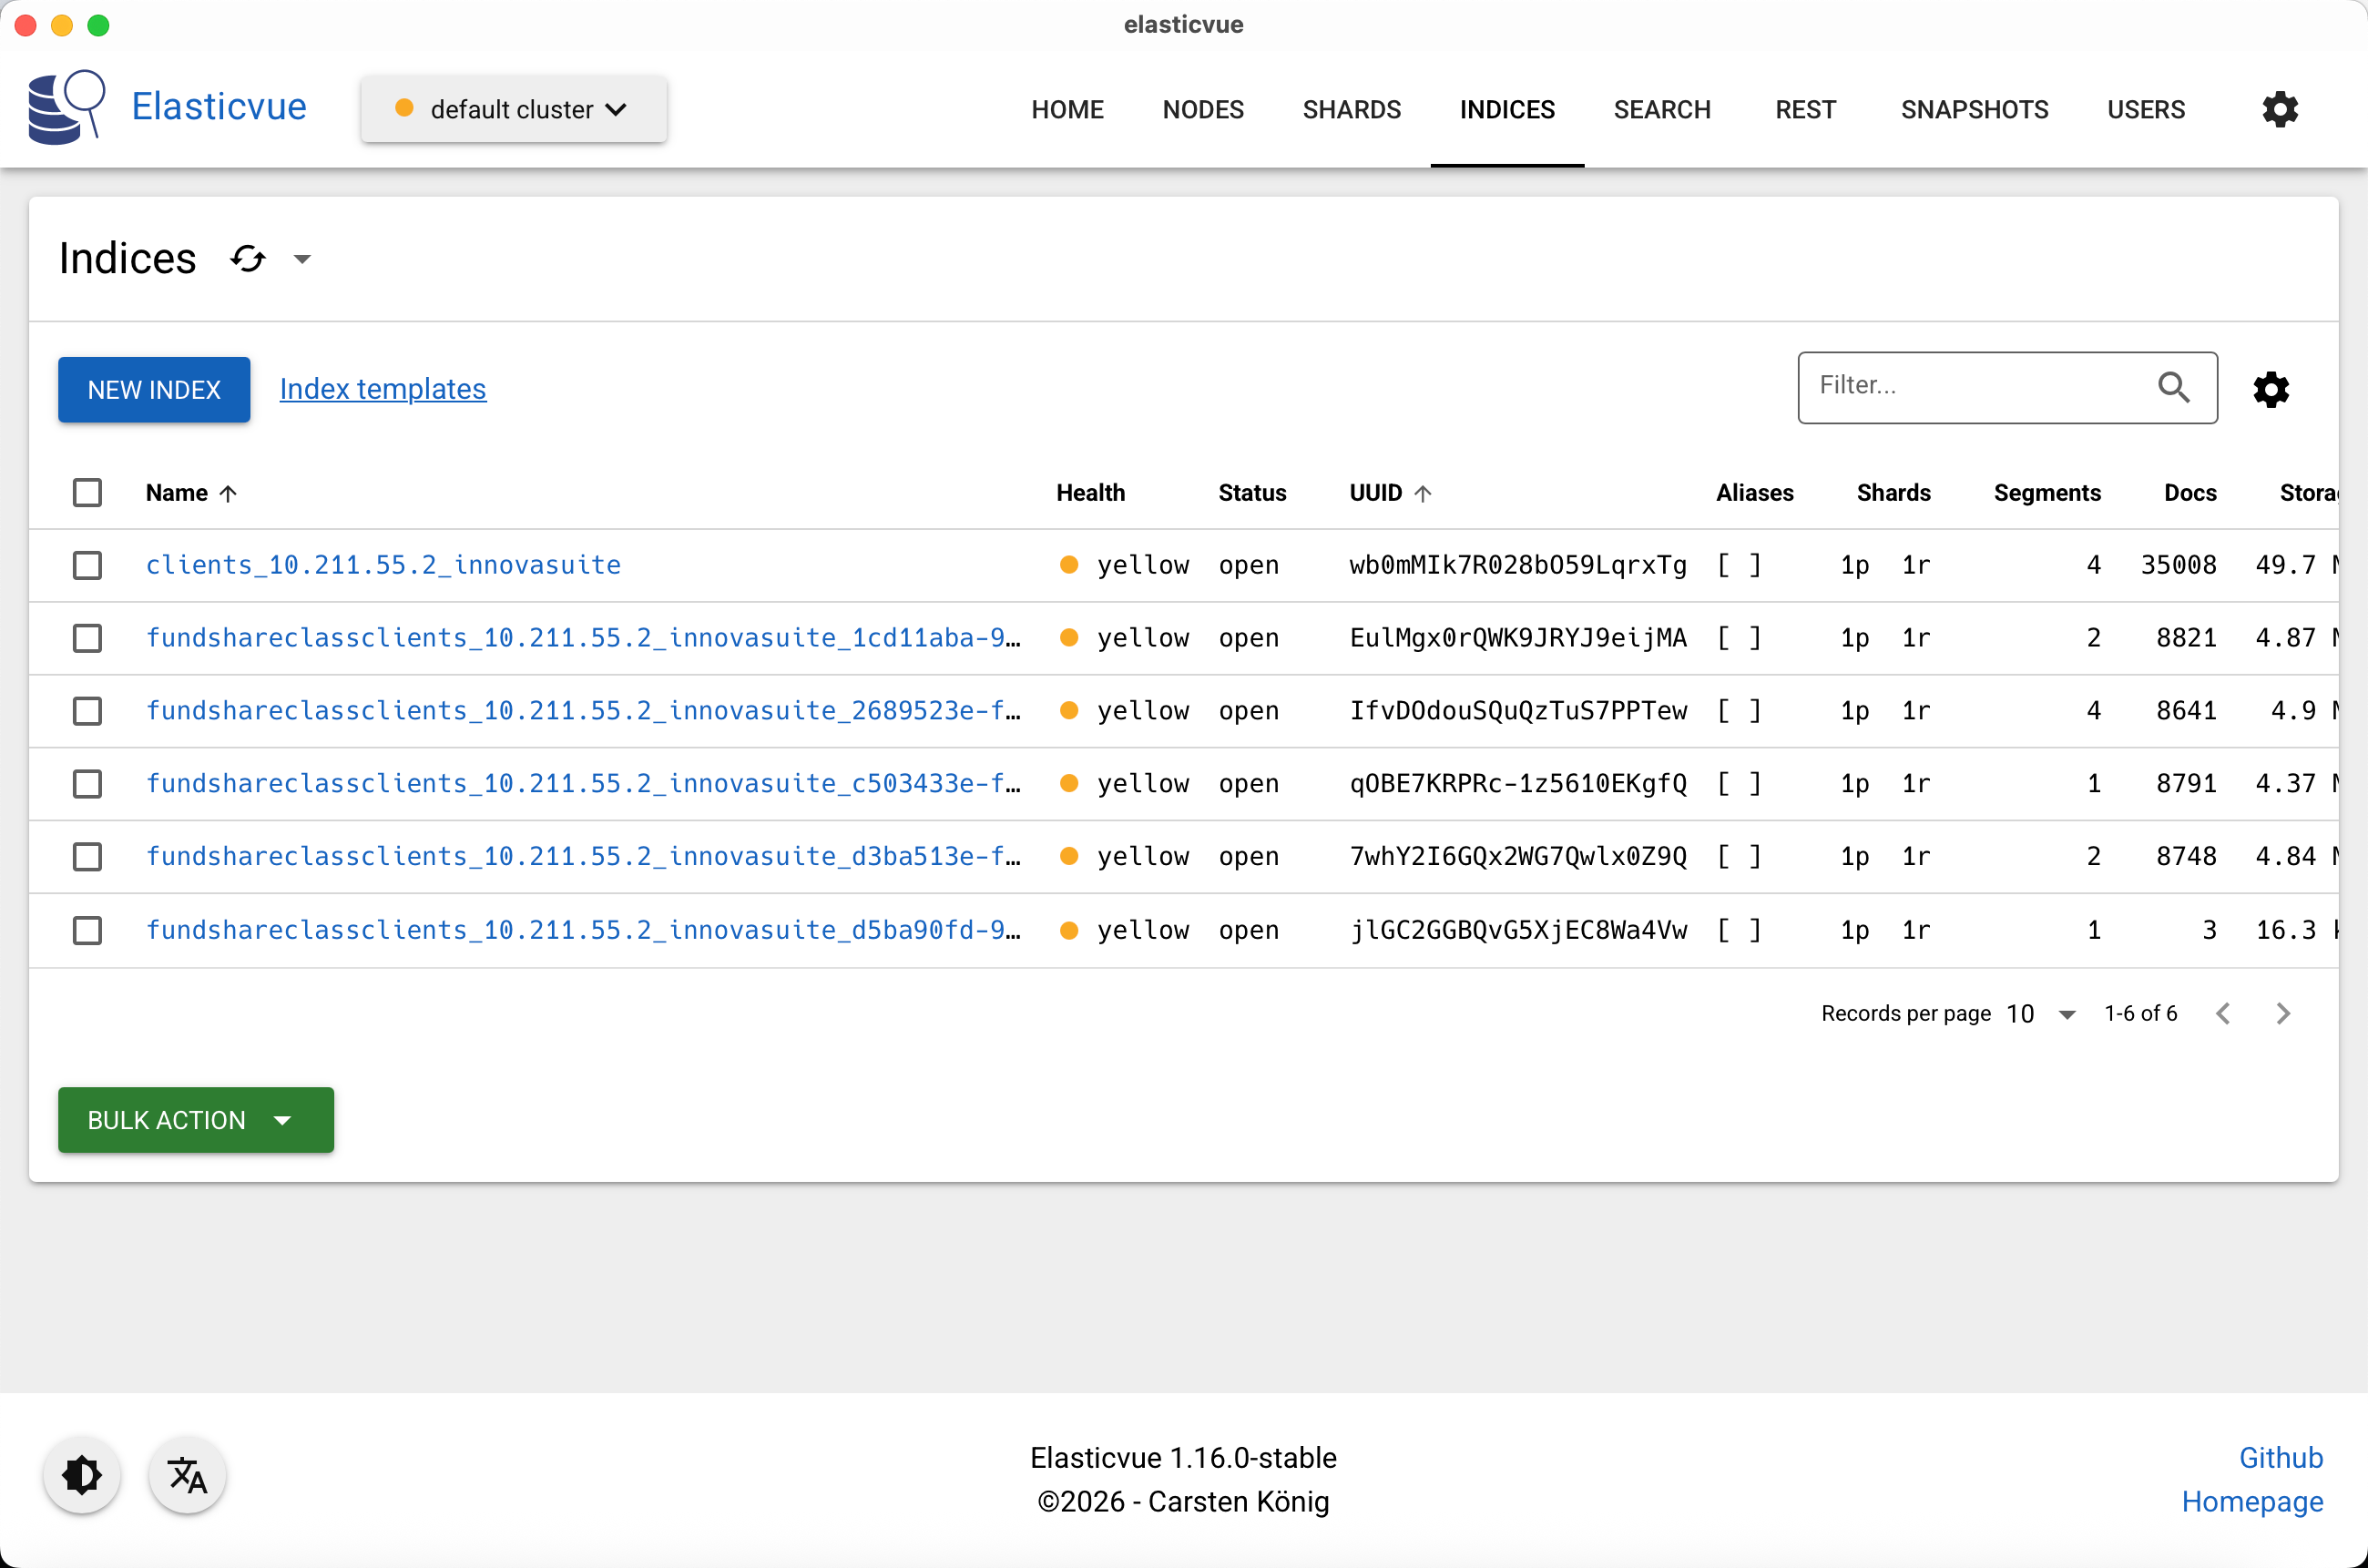
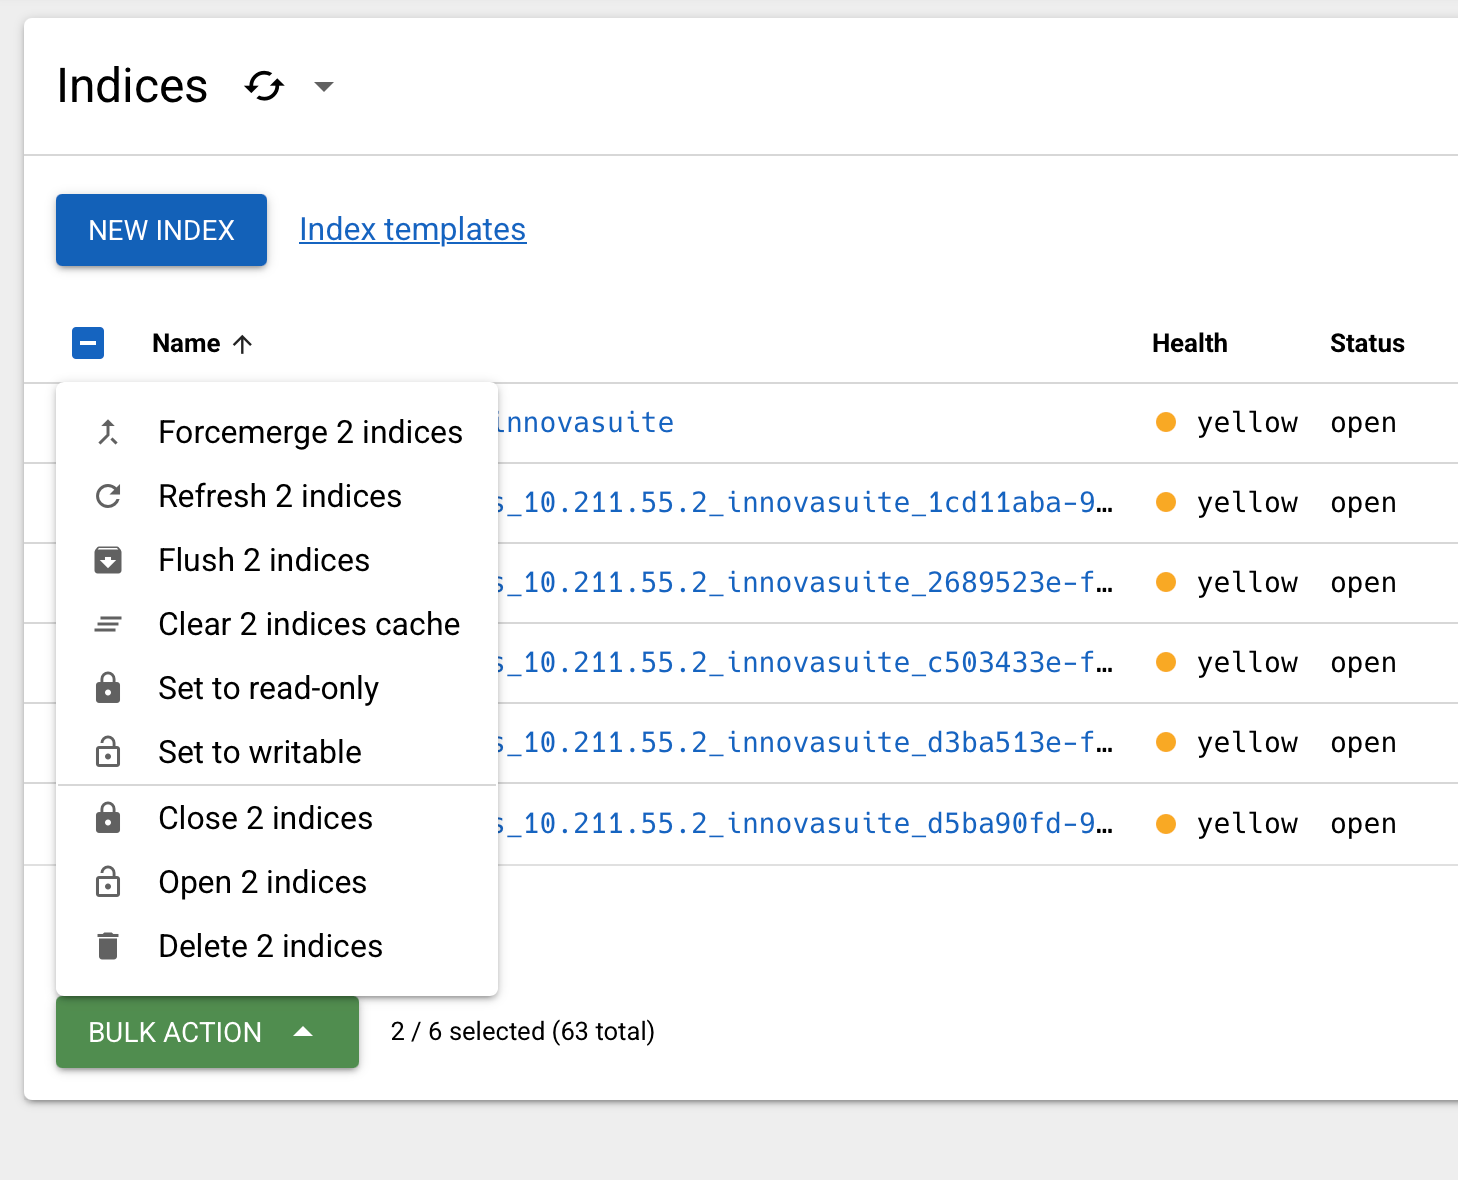
From here you can view the data, or select one or more indexes for management.
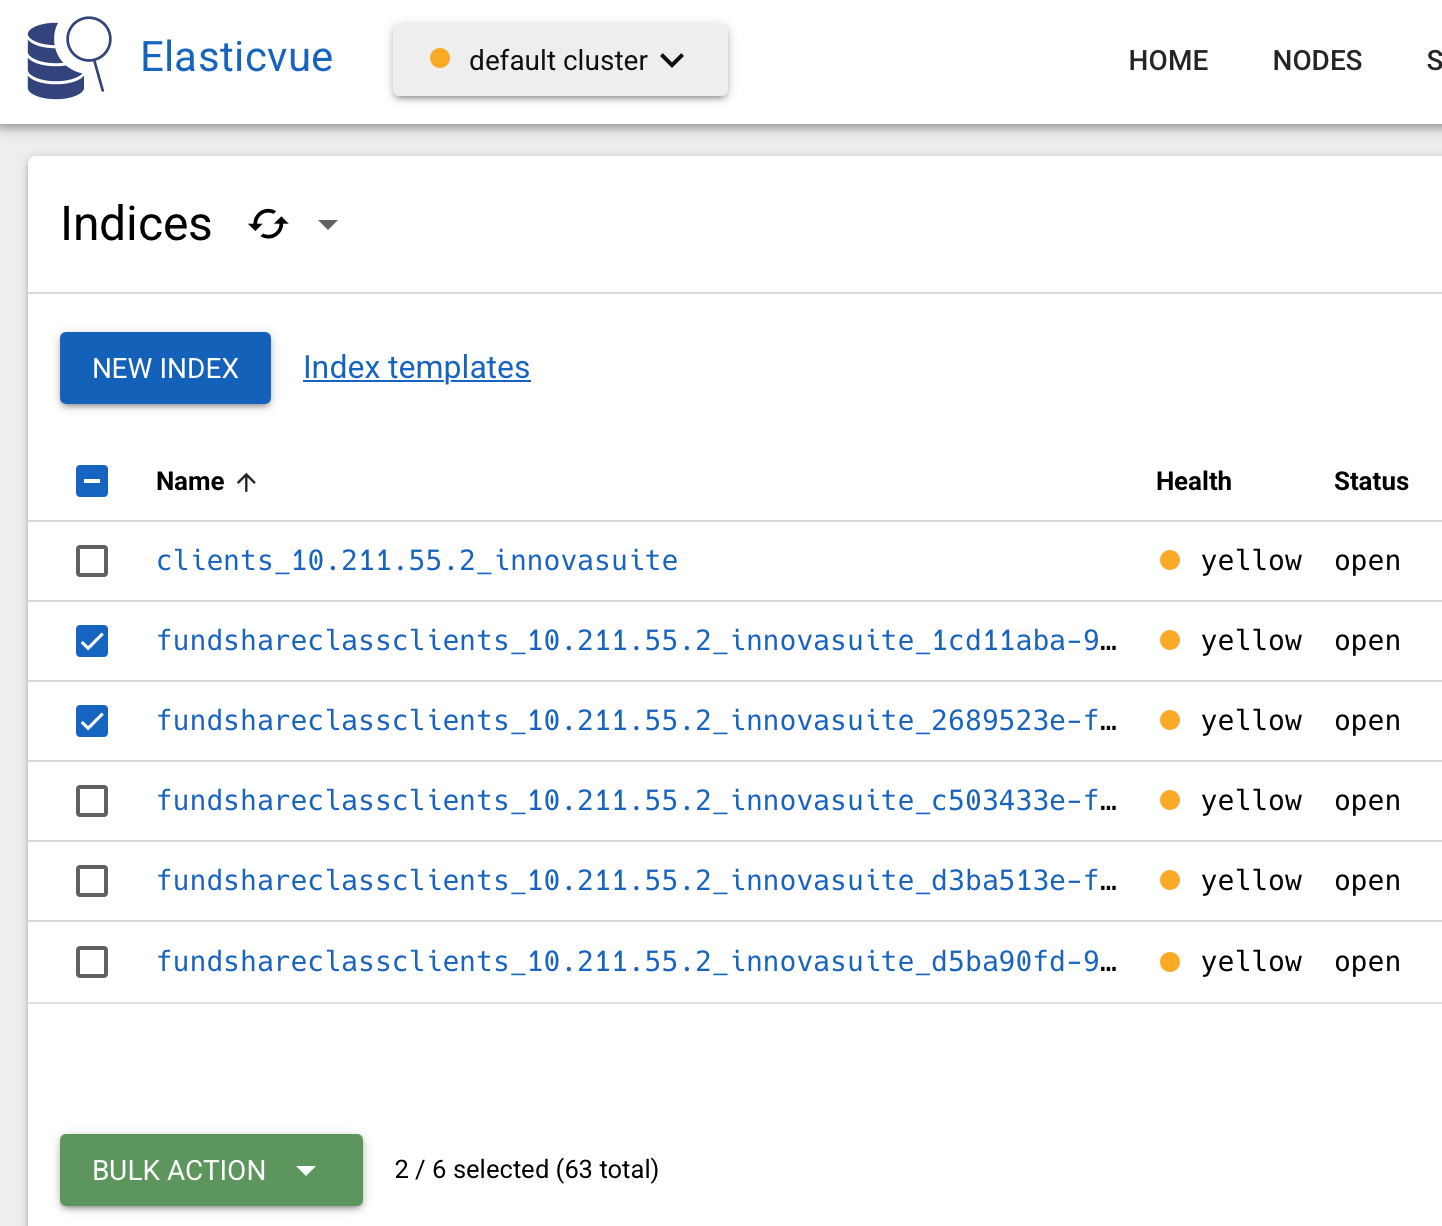
You can then click the ‘‘Bulk Action’’ button for actions you can carry out on the selected indexes.
TLDR
ElasticView is a powerful utility you can use to view and manage Elastic Search Indexes.